MONTHLY SEA SURFACE TEMPERATURE ANOMALY MAP
The following is a Global map of Reynolds OI.v2 Sea Surface Temperature (SST) anomalies for April 2016. It was downloaded from the KNMI Climate Explorer. The contour range was set to -2.5 to +2.5 deg C and the anomalies are referenced to the WMO-preferred period of 1981-2010.

April 2016 Sea Surface Temperature (SST) Anomalies Map
(Global SST Anomaly = +0.36 deg C)
MONTHLY GLOBAL OVERVIEW
Global Sea Surface Temperature anomalies made a downtick in April, a decrease of about -0.03 deg C. Surface temperature anomalies declined in both hemispheres. Last month, the only ocean basins to show warming were the polar oceans…the Arctic and Southern Oceans. The El Niño peaked in November, and it appears the global sea surface temperature response may have peaked as well.
The monthly Global Sea Surface Temperature anomalies are presently at +0.36 deg C, referenced to the WMO-preferred base years of 1981 to 2010.
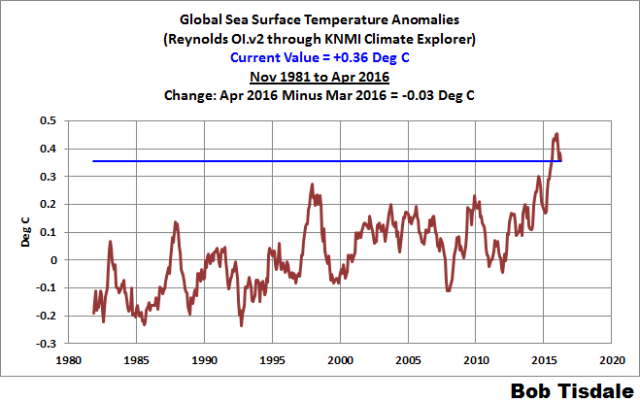
(1)Global Sea Surface Temperature Anomalies
Monthly Change = -0.03 deg C
THE EQUATORIAL PACIFIC
The monthly NINO3.4 Sea Surface Temperature anomalies for April 2016 are continuing to decline but they were still well above the +1.0 deg C threshold of a moderate strength El Niño. They are presently at +1.1 deg C, a decrease since the prior month…having declined about -0.59 deg C since March. (The Weekly data, as shown near the end of the post, have recently dropped below the threshold of a moderate-strength El Niño, but they’re still in the realm of a weak El Niño.)

(2) NINO3.4 Sea Surface Temperature Anomalies
(5S-5N, 170W-120W)
Monthly Change = -0.59 deg C
####################################
The sea surface temperature anomalies for the NINO3.4 region in the east-central equatorial Pacific (5S-5N, 170E-120E) are a commonly used index for the strength, frequency and duration of El Niño and La Nina events. We keep an eye on the sea surface temperatures there because El Niño and La Niña events are the primary cause of the yearly variations in global sea surface temperatures AND they are the primary cause of the long-term warming of global sea surface temperatures over the past 30 years. See the discussion of the East Pacific versus the Rest-of-the-World that follows. We present NINO3.4 sea surface temperature anomalies in monthly and weekly formats in these updates.
Also see the weekly values toward the end of the post.
INITIAL NOTES
Note 1: I’ve downloaded the Reynolds OI.v2 values from the KNMI Climate Explorer, using the base years of 1981-2010. The updated base years help to reduce the seasonal components in the ocean-basin subsets—they don’t eliminate those seasonal components, but they reduce them.
Note 2: I’ve moved the model-data comparison to the end of the post.
Note 3: I recently added a graph of the sea surface temperature anomalies for The Blob in the eastern extratropical North Pacific. It also is toward the end of the post.
Note 4: The sea surface temperature data in this post is the original (weekly/monthly, 1-deg spatial resolution) version of NOAA’s Optimum Interpolation (OI) Sea Surface Temperature (SST) v2 (aka Reynolds OI.v2)…not the (over-inflated, out-of-the-ballpark, extremely high warming rate) high-resolution, daily version of NOAA’s Reynolds OI.v2 data.
THE EAST PACIFIC VERSUS THE REST OF THE WORLD
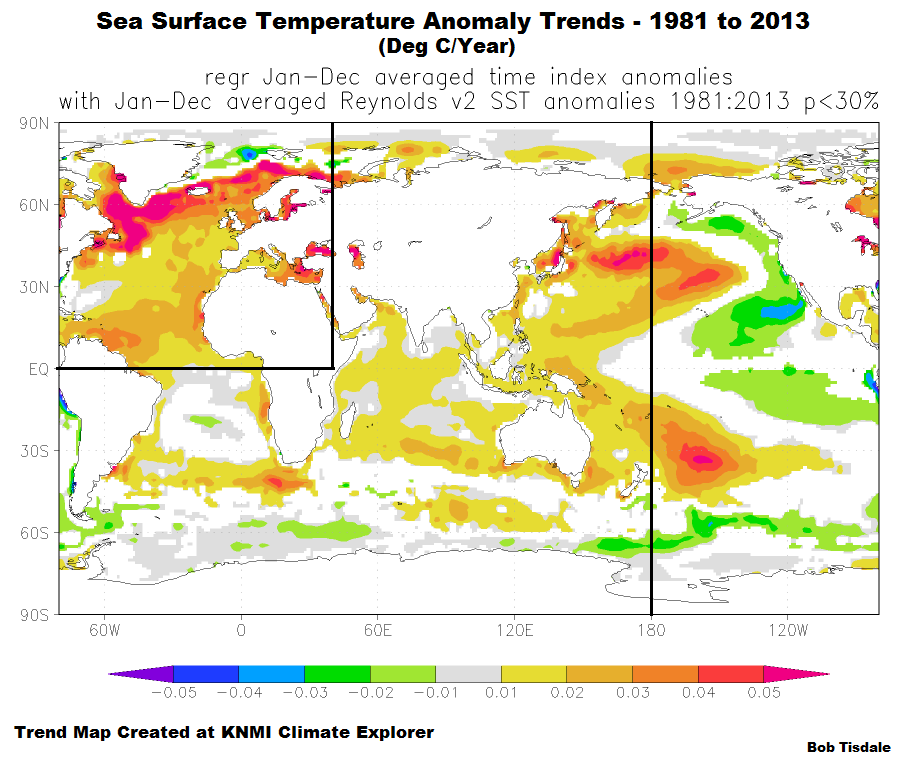
For years, we have shown and discussed that the surfaces of the global oceans have not warmed uniformly during the satellite era of sea surface temperature composite. In fact, some portions of the global oceans have cooled during that 3+ decade period. One simply has to look at a trend map for the period of 1982 to 2013 to see where the ocean surfaces had warmed and where they had not. Yet the climate science community has not addressed this.
The North Atlantic (anomalies illustrated later in the post) has had the greatest warming over the past 3+ decades, but the reason for this is widely known. The North Atlantic has an additional mode of natural variability called the Atlantic Multidecadal Oscillation. If you’re not familiar with the Atlantic Multidecadal Oscillation see the NOAA Frequently Asked Questions About the Atlantic Multidecadal Oscillation (AMO) webpage. As a result of the Atlantic Multidecadal Oscillation, the surface of the North Atlantic warmed at a rate that was more than twice the rate of the surface of the rest of the global oceans. See the trend comparison graph here.
The East Pacific Ocean also stands out in the trend map linked above. Some portions of its surfaces warmed and others cooled. It comes as no surprise then that the linear trend of the East Pacific (90S-90N, 180-80W) Sea Surface Temperature anomalies since the start of the Reynolds OI.v2 composite is so low. With the strong El Nino conditions in the eastern tropical Pacific and The Blob, it has acquired a slight positive trend, but it’s still far below the approximate +0.15 deg C/decade warming rate predicted by the CMIP5 climate models. (Note that the region also includes portions of the Arctic and Southern Oceans.) That is, there has been little warming of the sea surfaces of the East Pacific (from pole to pole) in 32 years. The East Pacific is not a small region. It represents about 33% of the surface area of the global oceans.
Notice how there appears to have been a strong El Niño event in 2014 in the East Pacific values, while there had only been a small off season event that year, and how the strong El Niño in 2015 is causing a further rise. Note also how there appears to have been a shift in 2013.

(3) East Pacific Sea Surface Temperature (SST) Anomalies
(90S-90N, 180-80W)
####################################
That leaves the largest region of the trend map, which includes the South Atlantic, the Indian and West Pacific Oceans, with the corresponding portions of the Arctic and Southern Oceans. Sea surface temperatures there warmed in very clear steps, in response to the significant 1986/87/88 and 1997/98 El Niño/La Niña events. It also appears as though the sea surface temperature anomalies of this subset have made another upward shift in response to the 2009/10 El Niño and 2010/11 La Niña events.
As you’ll note, the values for the South Atlantic, Indian and West Pacific Oceans appear now to be responding to the El Nino. Will we see an uptick like that associated with the 1997/98 El Niño?

(4) Sea Surface Temperature Anomalies of The South Atlantic-Indian-West Pacific Oceans
(Weighted Average of 0-90N, 40E-180 @ 27.9% And 90S-0, 80W-180 @72.1%)
####################################
The periods used for the average temperature anomalies for the South Atlantic-Indian-West Pacific subset between the significant El Niño events of 1982/83, 1986/87/88, 1997/98, and 2009/10 are determined as follows. Using the original NOAA Oceanic Nino Index (ONI) for the official months of those El Niño events, I shifted (lagged) those El Niño periods by six months to accommodate the lag between NINO3.4 SST anomalies and the response of the South Atlantic-Indian-West Pacific Oceans, then deleted the South Atlantic-Indian-West Pacific values that corresponds to those significant El Niño events. I then averaged the South Atlantic-Indian-West Pacific Oceans sea surface temperature anomalies between those El Niño-related gaps.
You’ll note I’ve ended the updates for the period after the 2009-10 El Niño. That was done to accommodate the expected response to the 2015/16 El Niño.
The Sea Surface Temperature anomalies of the East Pacific Ocean, or approximately 33% of the surface area of the global oceans, have shown comparatively little long-term warming since 1982 based on the linear trend. And between upward shifts, the Sea Surface Temperature anomalies for the South Atlantic-Indian-West Pacific subset (about 52.5% of the global ocean surface area) remain relatively flat, though they actually cool slightly. Anthropogenic forcings are said to be responsible for most of the rise in global surface temperatures over this period, but the Sea Surface Temperature anomaly graphs of those regions discussed above prompt a two-part question: Since 1982, what anthropogenic global warming processes would overlook the sea surface temperatures of 33% of the global oceans and have an impact on the other 52% but only during the months of the significant El Niño events of 1986/87/88, 1997/98 and 2009/10?
STANDARD NOTE ABOUT THE REYNOLDS OI.V2 COMPOSITE
The MONTHLY graphs illustrate raw monthly OI.v2 sea surface temperature anomalies from November 1981 to April 2016, as it is presented by the KNMI Climate Explorer linked at the end of the post. While NOAA uses the base years of 1971-2000 for this product, those base years cannot be used at the KNMI Climate Explorer because they extend before the start year of the product. (NOAA had created a special climatology for the Reynolds OI.v2 product.) I’ve referenced the anomalies to the period of 1981 to 2010, which is actually 1982 to 2010 for most months. And I’ve added a 13-month running-average filter to smooth out the seasonal variations.
MONTHLY INDIVIDUAL OCEAN AND HEMISPHERIC SEA SURFACE TEMPERATURE UPDATES

(5) Northern Hemisphere Sea Surface Temperature (SST) Anomalies
Monthly Change = -0.01 deg C
####################################

(6) Southern Hemisphere Sea Surface Temperature (SST) Anomalies
Monthly Change = -0.04 deg C
####################################

(7) North Atlantic Sea Surface Temperature (SST) Anomalies
(0 to 70N, 80W to 0)
Monthly Change = -0.08 deg C
####################################

(8) South Atlantic Sea Surface Temperature (SST) Anomalies
(0 to 60S, 70W to 20E)
Monthly Change = -0.06 deg C
####################################

(9) Pacific Sea Surface Temperature (SST) Anomalies
(60S to 65N, 120E to 80W)
Monthly Change = -0.03 Deg C
####################################

(10) North Pacific Sea Surface Temperature (SST) Anomalies
(0 to 65N, 100E to 90W)
Monthly Change = -0.01 Deg C
####################################

(11) South Pacific Sea Surface Temperature (SST) Anomalies
(0 to 60S, 120E to 70W)
Monthly Change = -0.07 deg C
####################################

(12) Indian Ocean Sea Surface Temperature (SST) Anomalies
(60S to 30N, 20E to 120E)
Monthly Change = +0.00 deg C
####################################

(13) Arctic Ocean Sea Surface Temperature (SST) Anomalies
(65N to 90N)
Monthly Change = +0.02 deg C
####################################

(14) Southern Ocean Sea Surface Temperature (SST) Anomalies
(90S-60S)
Monthly Change = +0.06 deg C
####################################
WEEKLY SEA SURFACE TEMPERATURE ANOMALIES
Weekly NINO3.4 sea surface temperature anomalies are at +0.8 deg C. Based on the weekly Reynolds OI.v2 data, they peaked at a higher anomaly than the 1997/98 El Niño. But as discussed, the 1997/98 El Niño was a stronger East Pacific El Niño than the one taking place now.

(15) Weekly NINO3.4 Sea Surface Temperature (SST) Anomalies
Note: I’ve used the weekly NINO3.4 values available from the NOAA/CPC Monthly Atmospheric & SST Indices webpage, specifically the listing here. They do not provide the global values on a weekly basis, so I can’t present it. Sorry.
####################################
MODEL-DATA COMPARISON: To counter the nonsensical “Just what AGW predicts” rantings of alarmists about the “record-high” global sea surface temperatures in 2014 and 2015, I’ve added a model-data comparison of satellite-era global sea surface temperatures to these monthly updates. See the example below. The models are represented the multi-model ensemble-member mean of the climate models stored in the CMIP5 archive, which was used by the IPCC for their 5th Assessment Report. For further information on the use of the model mean, see the post here. For most models, historic forcings run through 2005 (2012 for others) and the middle-of-the-road RCP6.0 forcings are used after in this comparison. The data are represented by NOAA’s Optimum Interpolation Sea Surface Temperature data, version 2—a.k.a. Reynolds OI.v2—which is NOAA’s best. The model outputs and data have been shifted so that their trend lines begin at “zero” anomaly for the (November, 1981) start month of this composite. That “zeroing” helps to highlight how poorly the models simulate the warming of the ocean surfaces…noticeably higher than the observed warming rate. Both the Reynolds OI.v2 values and the model outputs of their simulations of sea surface temperature (TOS) are available to the public at the KNMI Climate Explorer.
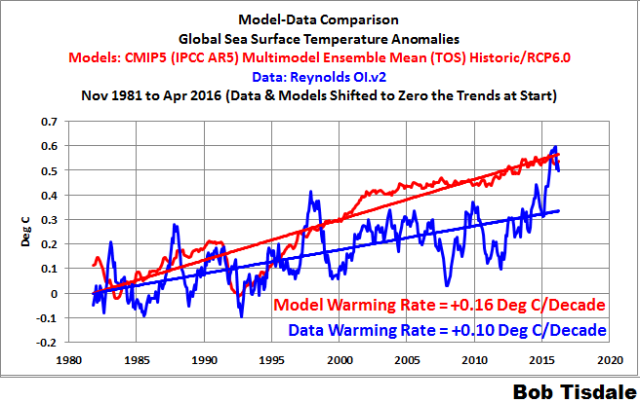
000 – Model-Data Comparison
####################################
THE BLOB
After decades of no surface warming in the North Pacific as a whole, a prolonged weather event in the eastern extratropical North Pacific caused an unusual and unexpected warming there, raising sea surface temperatures in the North Pacific to new levels. That region of unusually warm sea surfaces in the eastern extratropical North Pacific has become known as The Blob.
The Blob has returned to the neighborhood of “Normal” values, but it made a sizeable uptick in April. We’ll keep an eye on it for a few more months to see if it reemerges.

(16) The Blob
(40N-50N, 150W-130W)
Monthly Change = +0.24 deg C


